|
History
| Log In
|
|
|
|
Yes our data is huge. Around 120 agents running.
So what are the recommended values for database and for server?
Any answer?
After upgrade to 7.x QB, we encounter a slow down. Our QB server is 30GB of RAM (and still using swap? that is strange) around 120 nodes connected DB is MySQL with 2GB of RAM How can we check what is causing the problems of random slowdowns. What do you recommend to profile the application Hi Piotr,
I think 30GB of RAM is more than enough for QuickBuild, I'd suggest you just give 8-10GB to QuickBuild. Instead you need add more RAM to MySQL. In your case, I think you can give 8GB or more RAM to MySQL. And you'd better run your builds on the agents instead of running them on server node, server node is just used for dispatching jobs to the agents and used for displaying the web UI. Previously we had 16GB RAM dedicated to QB server, and the Heap meater was going to 99% quite fast. Even with 30GB we still see it going up to 85% once per hour. It all happened after moving from 6.x to 7.x .
We do not run any builds on master server. All of them are running on the nodes. What else can we check? It is abnormal that so much memory is consumed by QB. Please reduce the maxmemory setting to 8G (so we can get the memory dump not too large), and then edit "conf/wrapper.conf" to add below setting:
wrapper.java.additional.4=-XX:+HeapDumpOnOutOfMemoryError wrapper.java.additional.5=-XX:HeapDumpPath=./heapdump.bin This will make QB dumps memory when there is an OOE. Then please upload the heapdump to DropBox and send me a link for diagnostics. Also make sure that you do not have scripts or restful programs querying QB database for all builds/all configurations or large sets of data frequently, which will consume a lot of resources.
OutOfMemory did not occur even on small Heap size, as the GC is freeing it up, so unfortunately I do not have a heap dump.
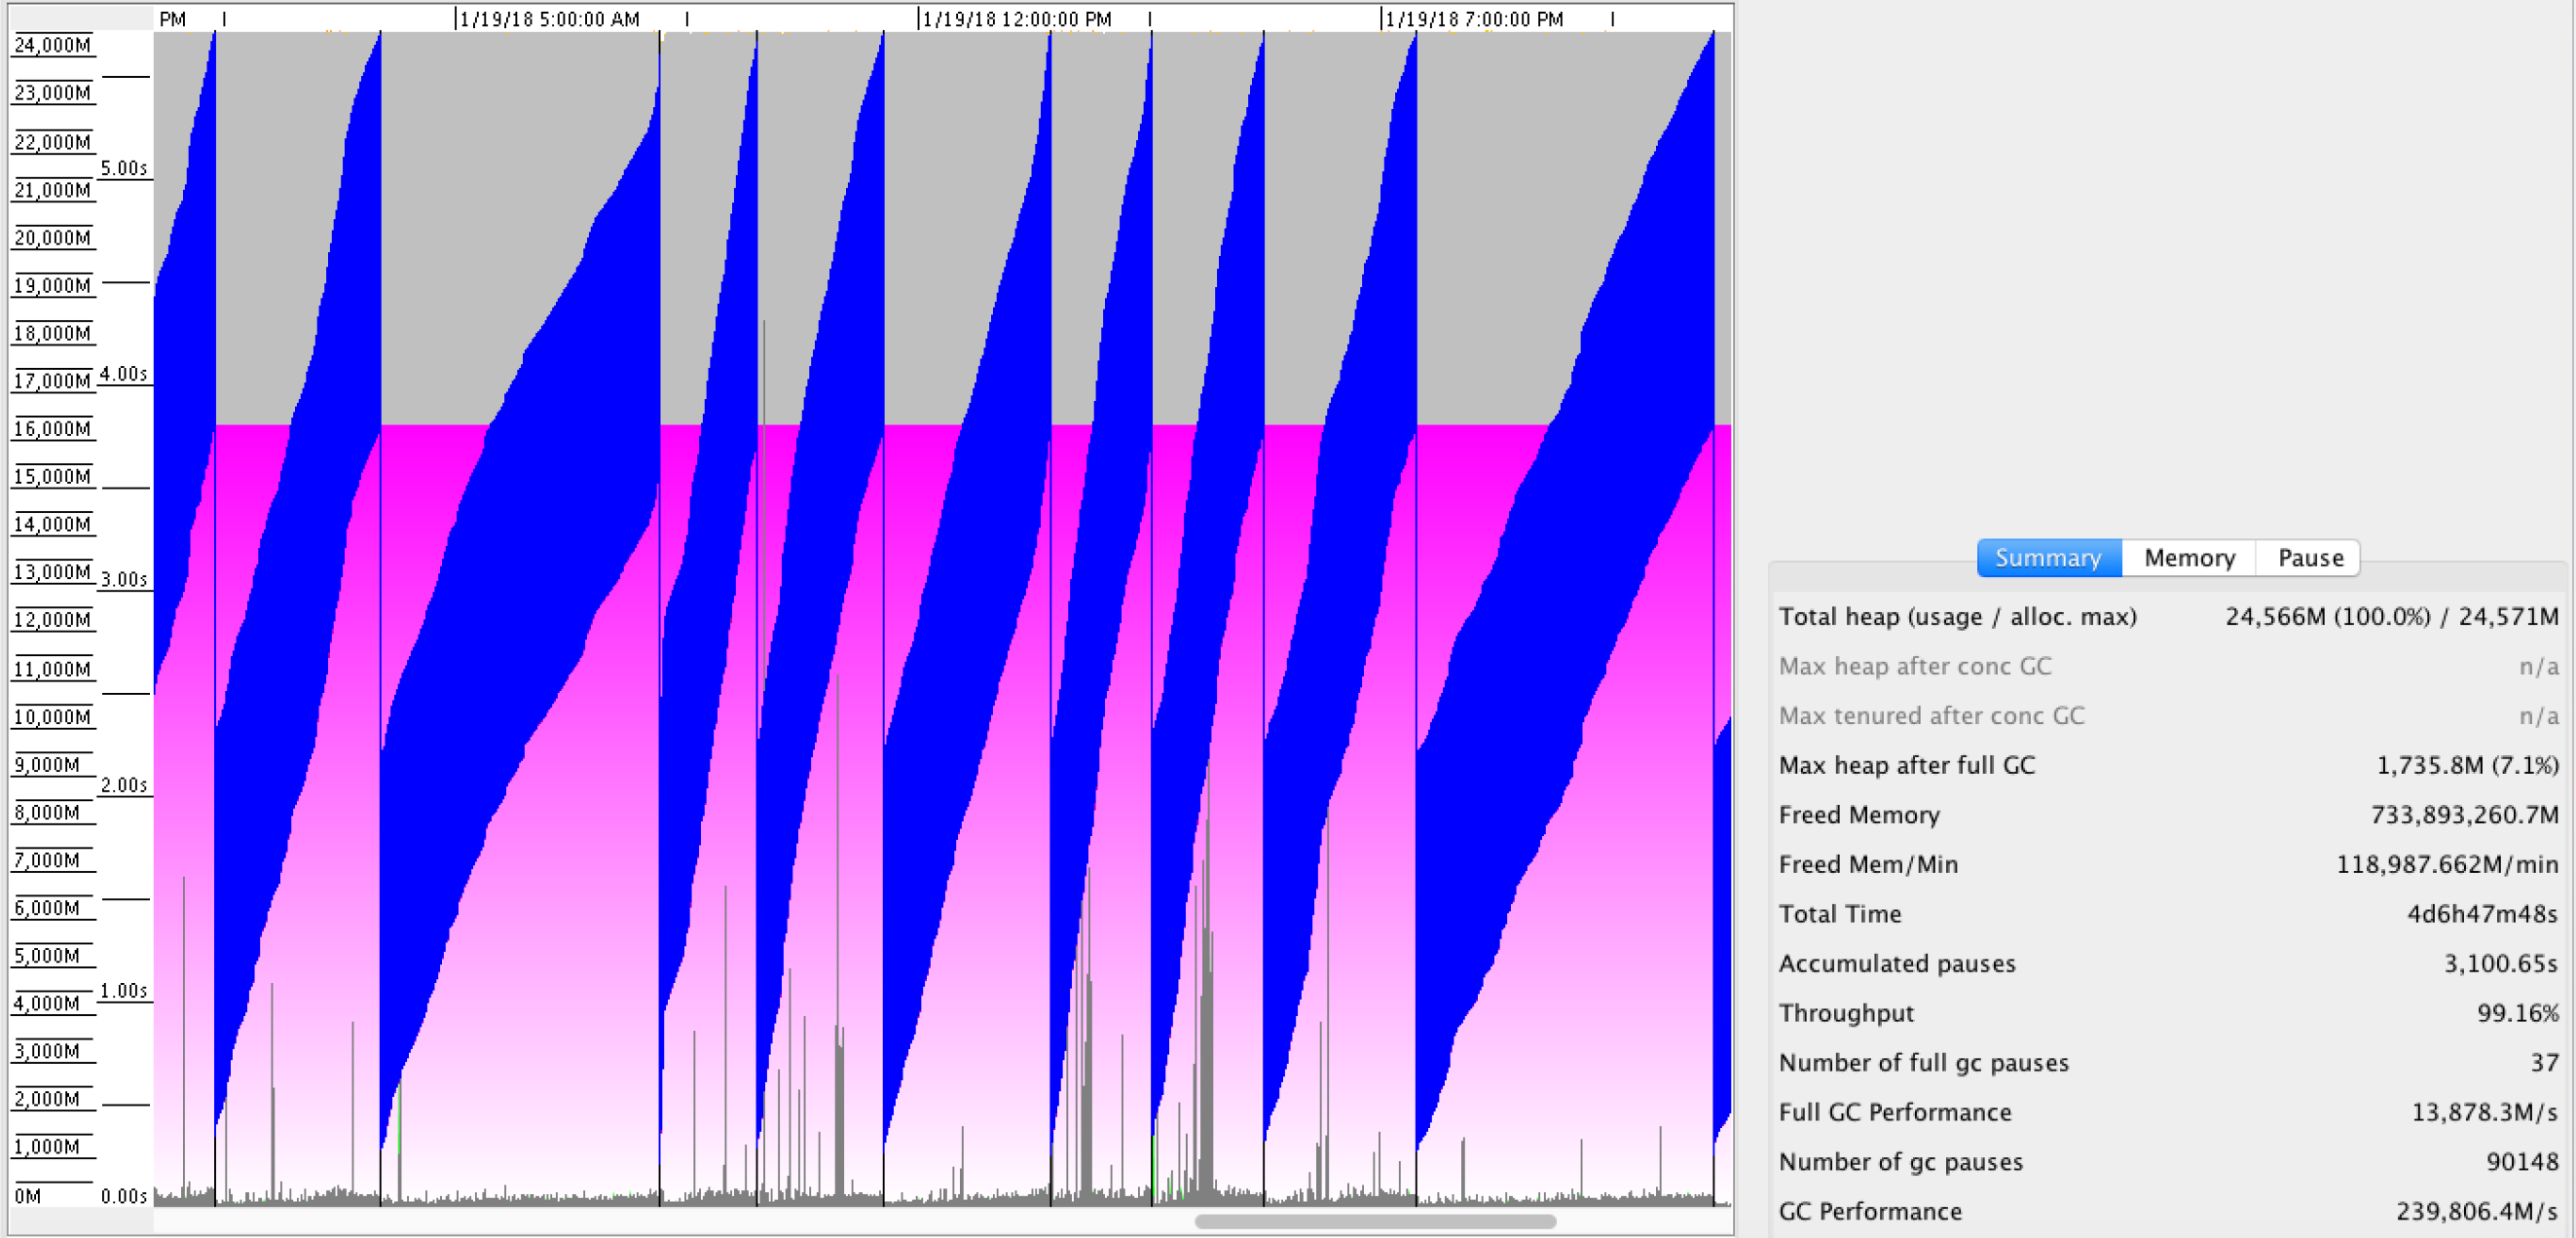
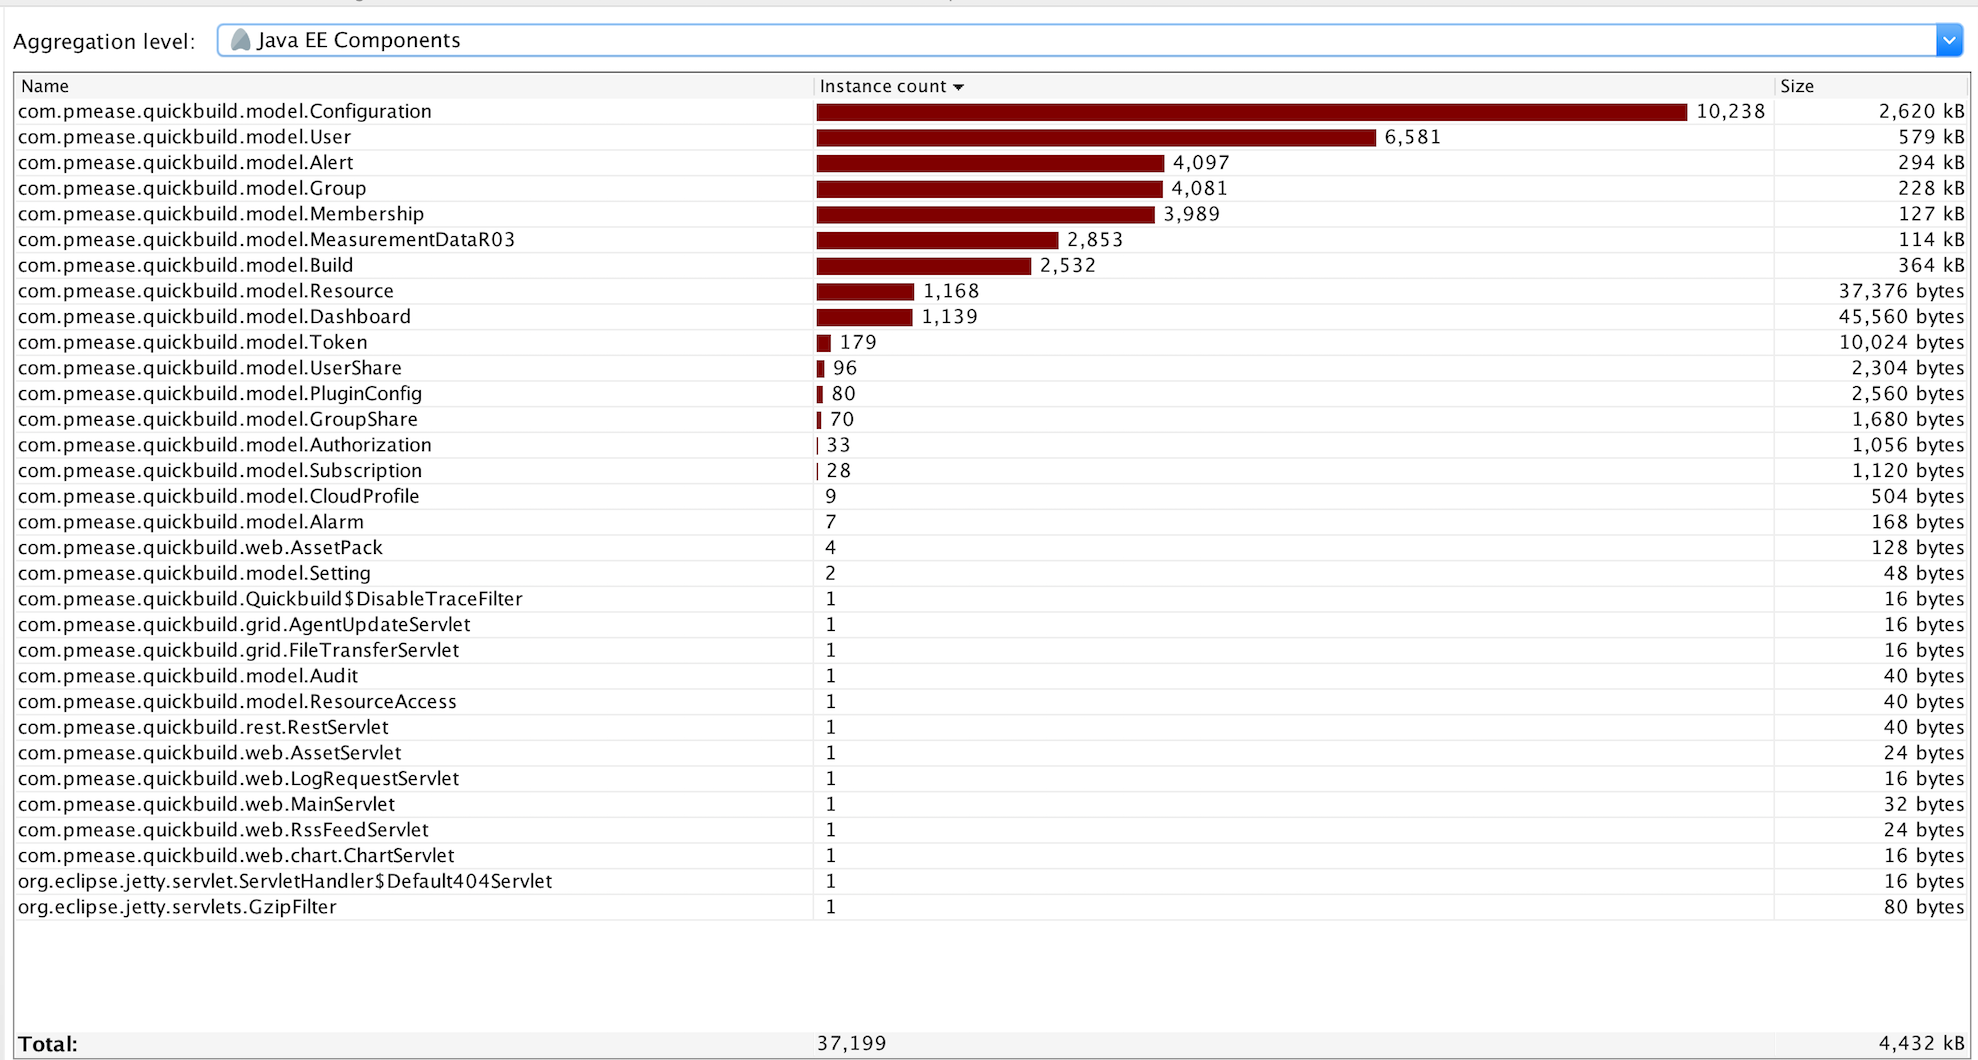
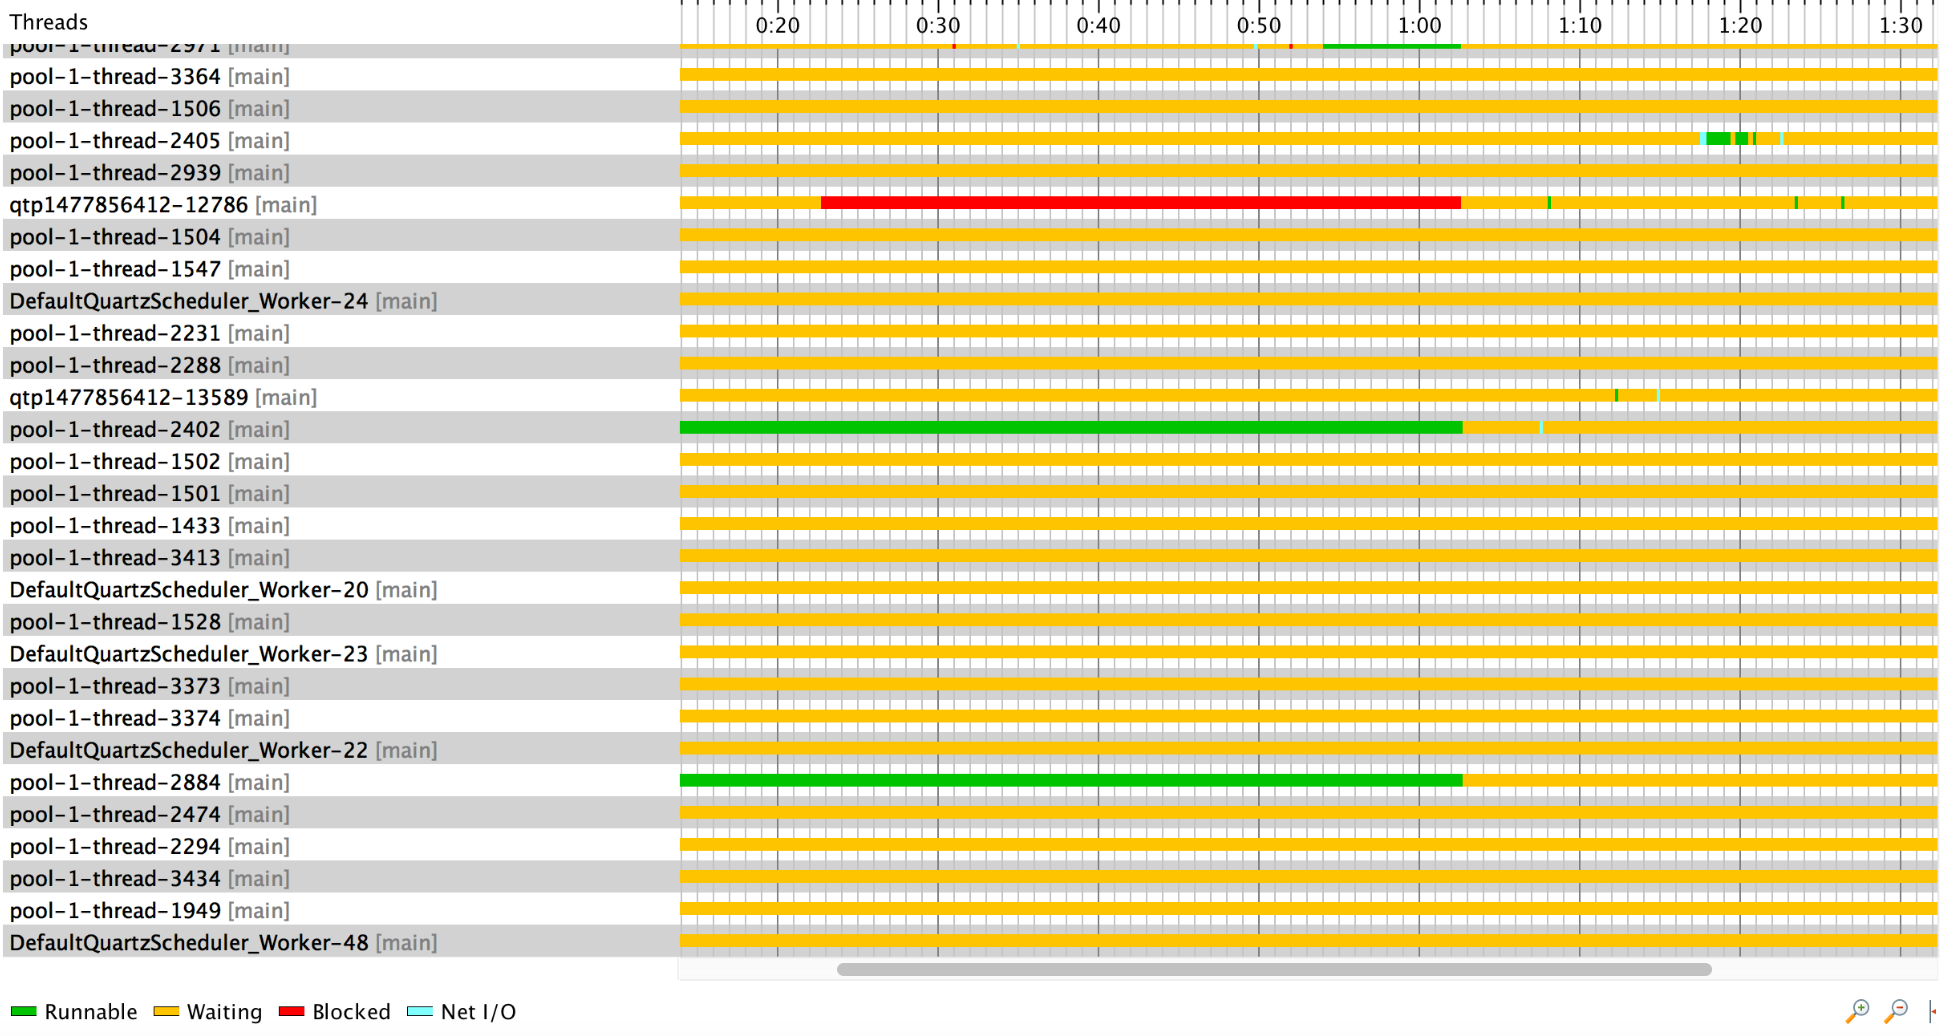
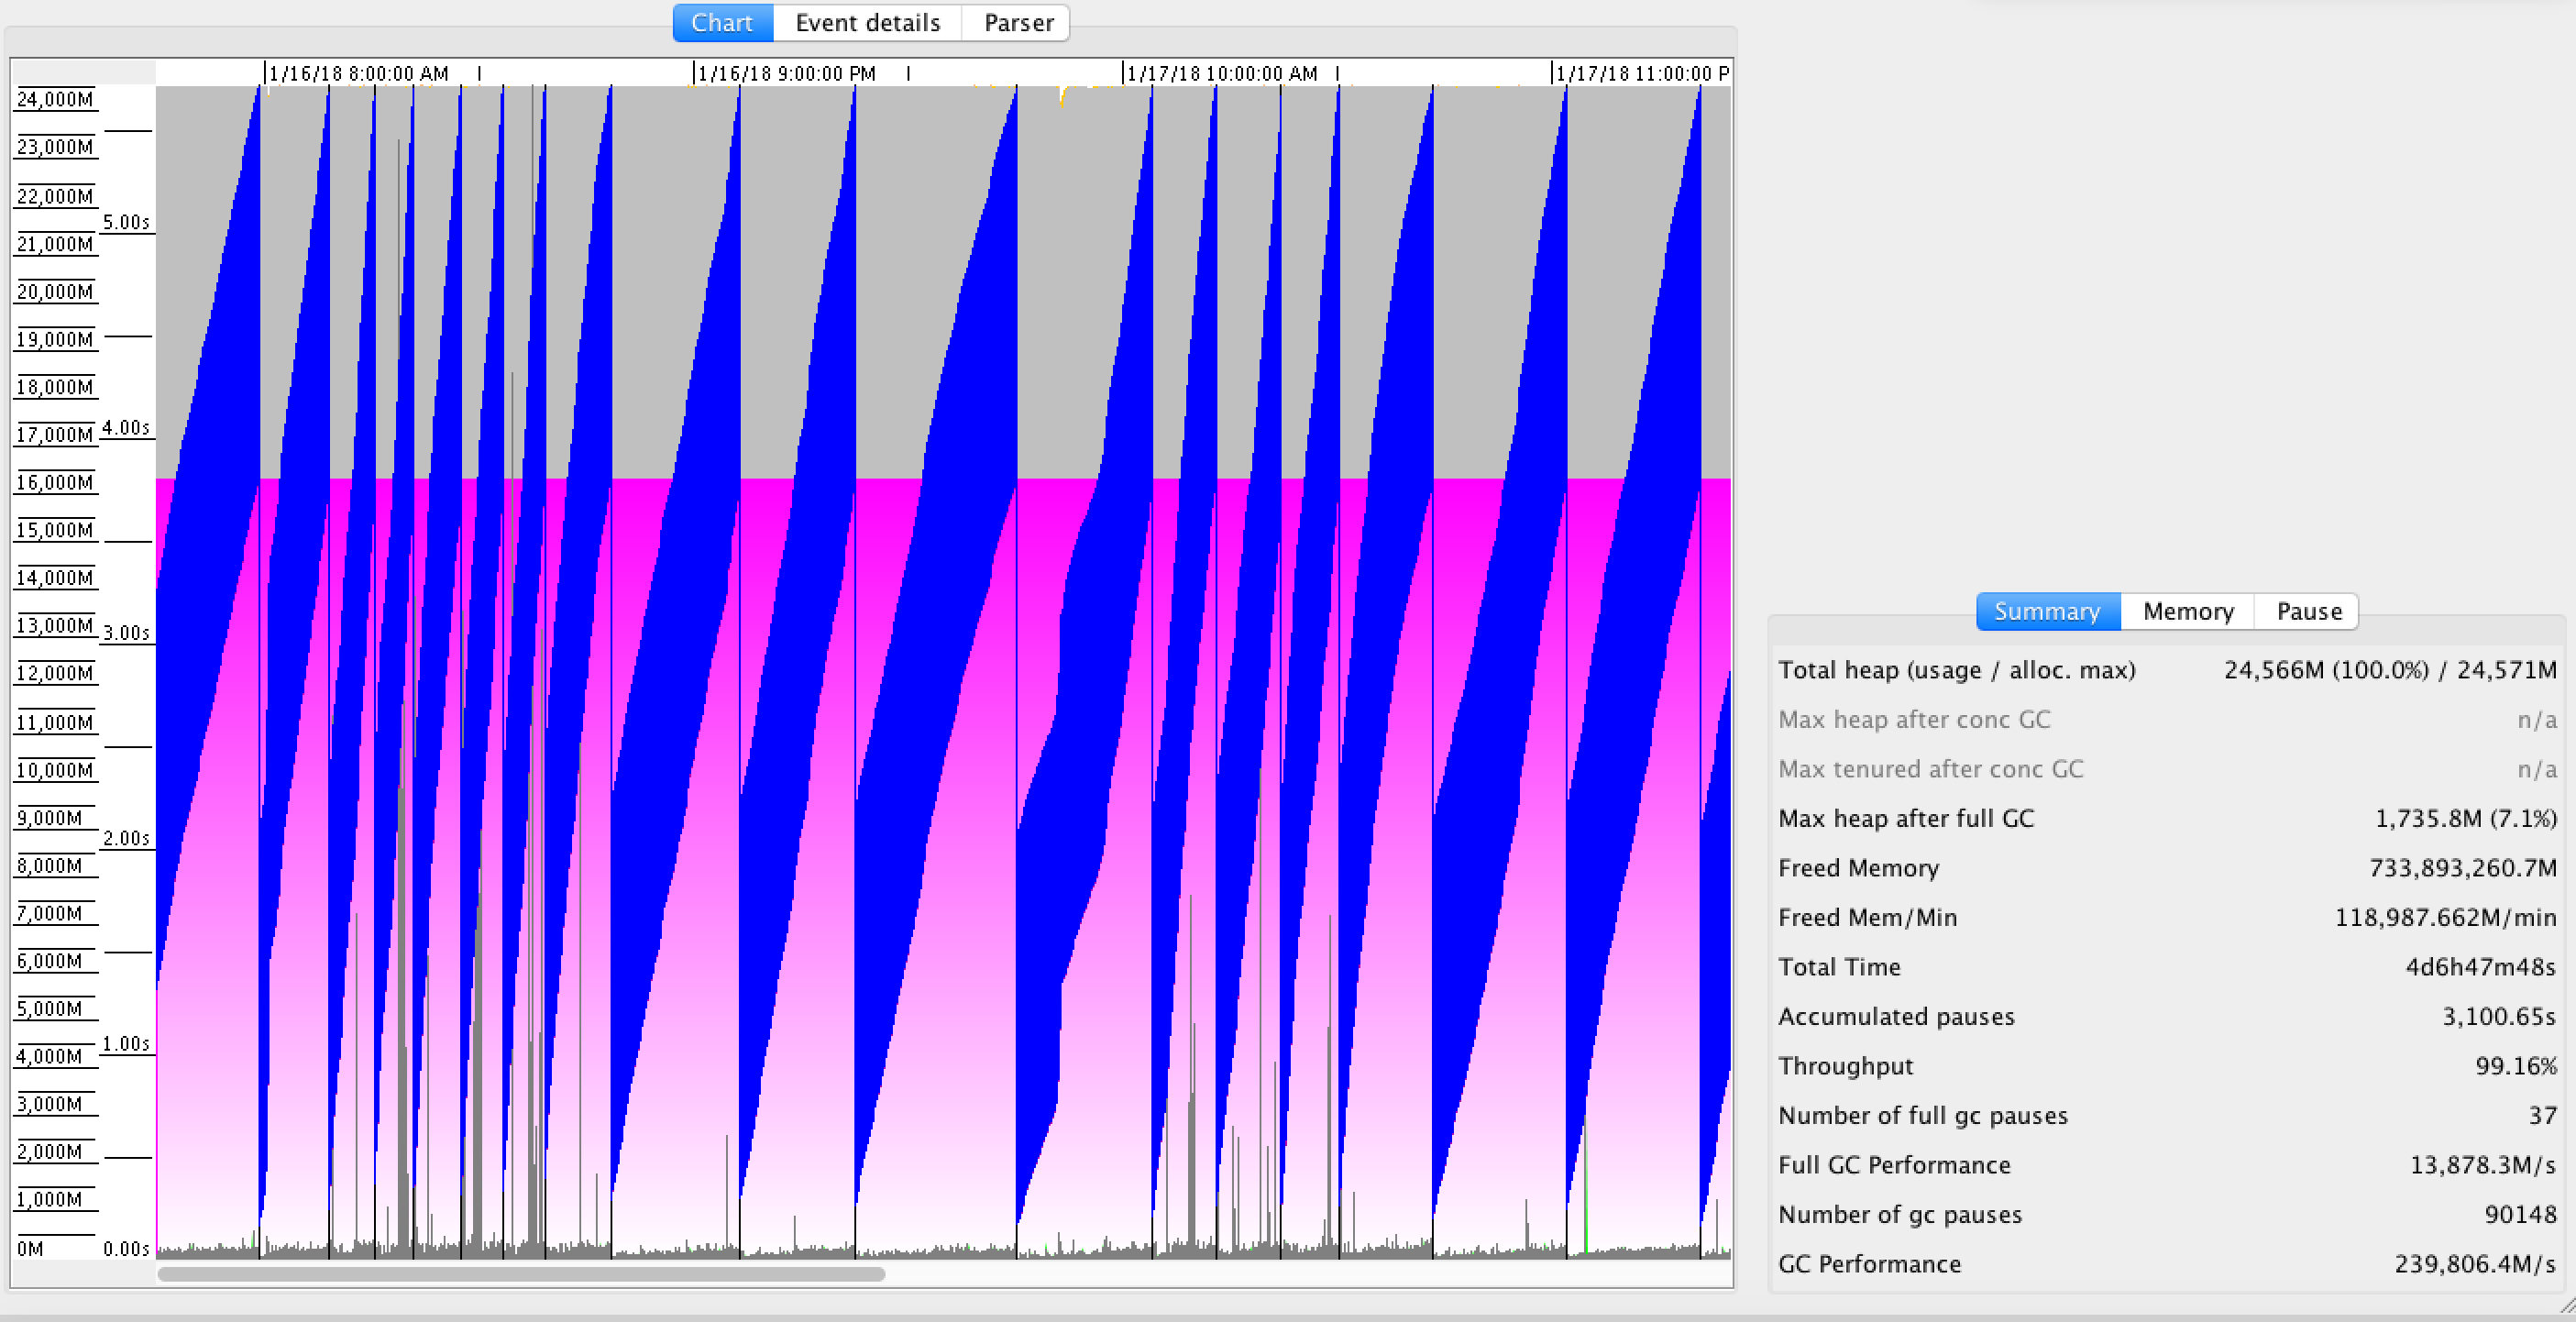
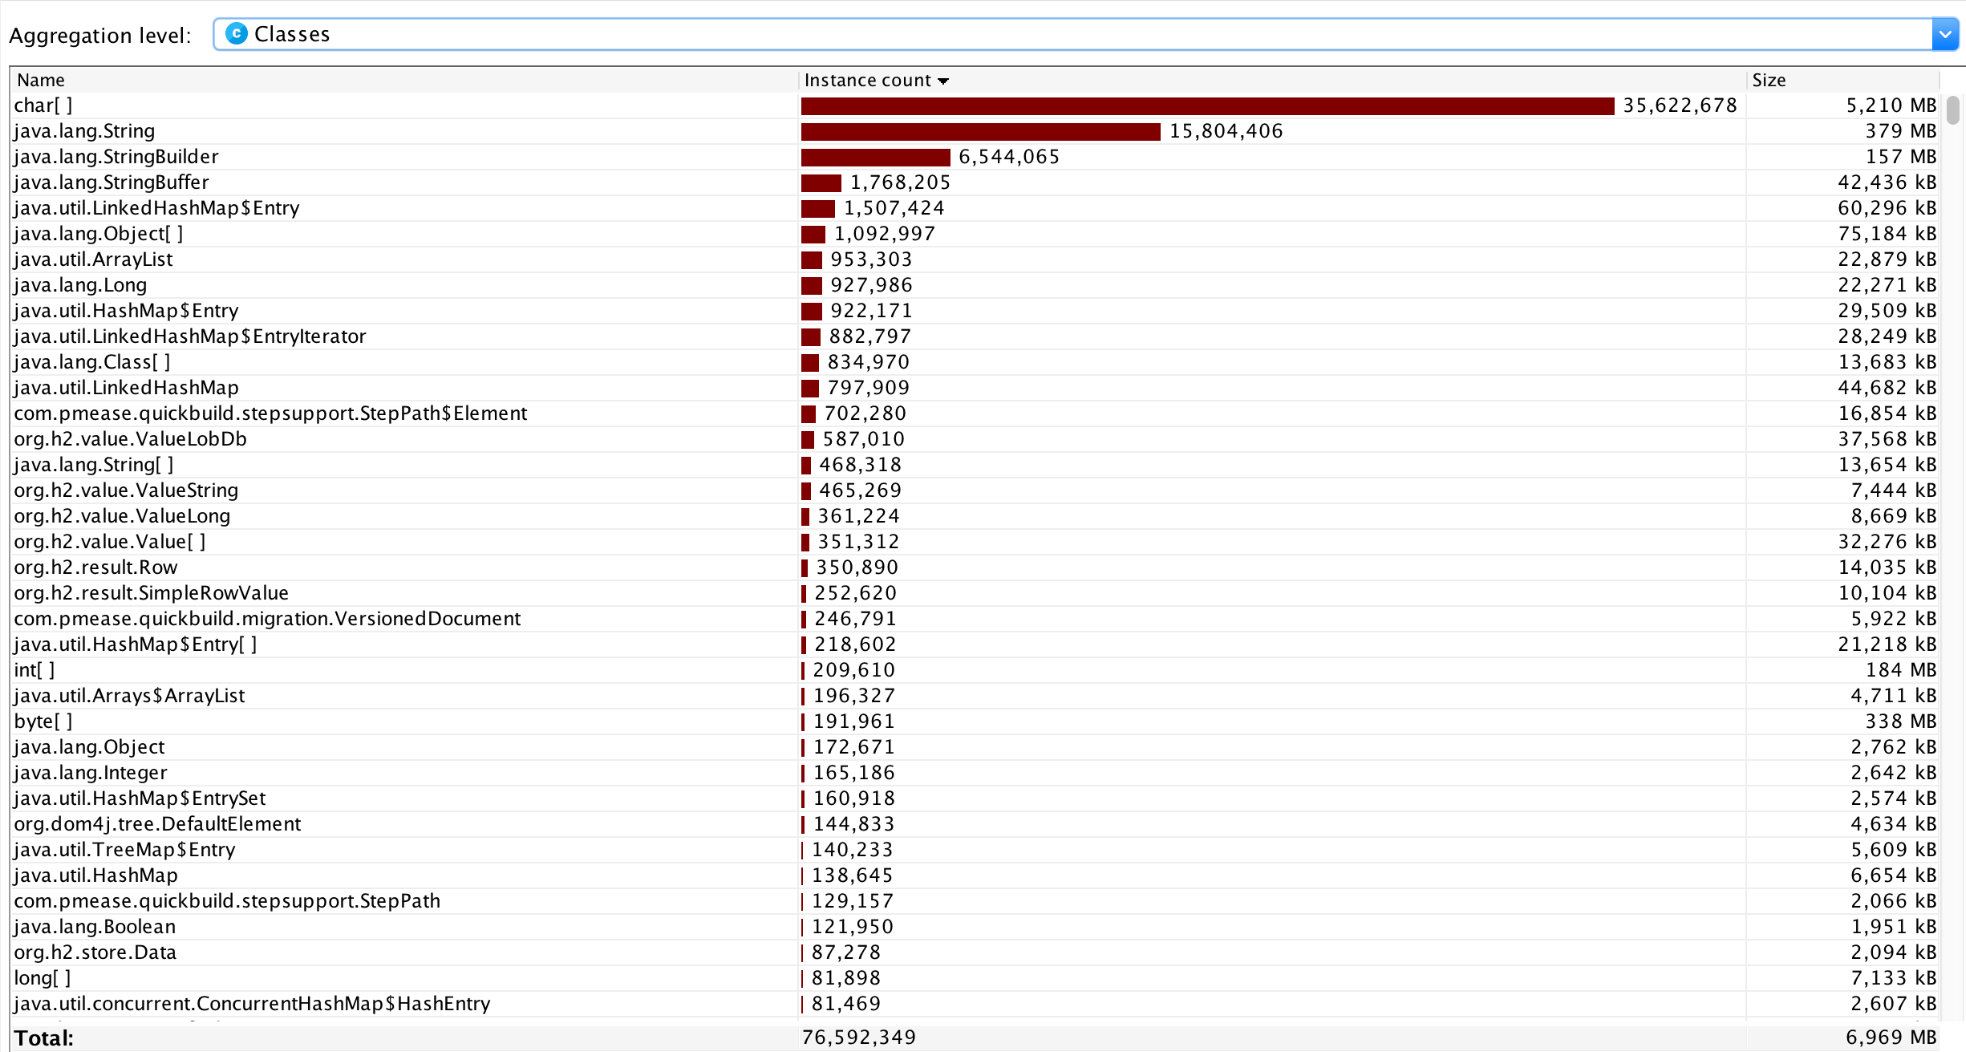
Nevertheless we have increased memory for database up to 10GB, and reduced the QB server memory to 16GB Based on the jvm.log produced for GC runs we can clearly see that memory usage is growing and growing, and after some time Full GC run is executed. (attached jvm.log and screenshot) Additionally we tried as well JProfiler to check what is happening there. Here are our investigation points: - there is a bunch (up to 70% of memory) instances of char[], most of which comes from EhCache (should it be growing so high? ) - each entrance/even refresh to the web ui generates 3000 instances of Configuration class (maybe Dashboard queries are not good in case of caching and performance?) - sometimes we get up to 700 threads (a big amount of them is H2 log, or a H2 database storage JUnit) - sometimes we can be blocked threads with name: qtp... (why ? ) Our setup : additional wrapper config: wrapper.java.additional.auto_bits=TRUE wrapper.java.additional.1=-Djava.awt.headless=true wrapper.java.additional.2=-Xverify:none #wrapper.java.additional.3=-Dreset wrapper.java.initmemory=16384 wrapper.java.maxmemory=16384 wrapper.app.parameter.1=com.pmease.quickbuild.bootstrap.Bootstrap wrapper.app.parameter.2=1 wrapper.app.parameter.3=start wrapper.app.parameter.4=com.pmease.quickbuild.bootstrap.Bootstrap wrapper.app.parameter.5=FALSE wrapper.app.parameter.6=1 wrapper.app.parameter.7=stop wrapper.console.format=PM wrapper.console.loglevel=INFO wrapper.logfile=../logs/console.log wrapper.logfile.format=PM wrapper.logfile.loglevel=INFO wrapper.logfile.maxsize=20M wrapper.logfile.maxfiles=10 wrapper.java.additional.3=-XX:MaxPermSize=512m wrapper.java.additional.4=-Xss300k # in order to avoid the 'unable to create new native thread' exception wrapper.java.additional.5=-XX:+UseParallelOldGC wrapper.java.additional.6=-XX:ParallelGCThreads=8 wrapper.java.additional.7=-XX:MaxGCPauseMillis=2000 wrapper.java.additional.8=-Xloggc:../logs/jvm.log wrapper.java.additional.9=-XX:+PrintGCDetails wrapper.java.additional.10=-XX:+PrintGCTimeStamps wrapper.java.additional.11=-XX:+PrintGCDateStamps wrapper.java.additional.12=-XX:+StartAttachListener wrapper.java.additional.13=-XX:+HeapDumpOnOutOfMemoryError wrapper.java.additional.14=-XX:HeapDumpPath=./heapdump.bin wrapper.java.additional.16=-Dcom.sun.management.jmxremote wrapper.java.additional.17=-Dcom.sun.management.jmxremote.ssl=false wrapper.java.additional.18=-Dcom.sun.management.jmxremote.authenticate=false wrapper.java.additional.19=-Dcom.sun.management.jmxremote.port=1099 hibernate: hibernate.connection.autocommit=true hibernate.c3p0.min_size=5 hibernate.c3p0.max_size=125 hibernate.c3p0.max_statements=0 hibernate.c3p0.idle_test_period=600 hibernate.show_sql=false hibernate.format_sql=true hibernate.use_sql_comments=true javax.persistence.validation.mode=none hibernate.validator.apply_to_ddl=false hibernate.cache.provider_class=org.hibernate.cache.EhCacheProvider hibernate.cache.use_query_cache=true Jetty: <Set name="ThreadPool"> <New class="org.eclipse.jetty.util.thread.QueuedThreadPool"> <Set name="minThreads">64</Set> <Set name="maxThreads">1024</Set> </New> </Set> <Ref id="SocketConnector"> <Set name="acceptors">16</Set> <Set name="acceptQueueSize">256</Set> <Set name="StatsOn">true</Set> </Ref> Are we missing something? What else could we check? And finally can we have a direct contact to the person who can help us with performance issues with QB server? | ||||||||||||||||||||||||||||||||||||||||||||||||||||||||||||||||||||||

how many maximum open connections should be set for QB hibernate config?