|
History
| Log In
|
|
|
|
[
Permlink
| « Hide
]
Robin Shen [02/Apr/16 12:40 AM]
Please check the server log to see if there are any errors being printed when expected build time reaches. Also please check the server log to see if QB bellieves that the build condition is not satisfied at that time.
There are no log entries at all regarding the "missing" requests/builds. It is just as if they do not happen at all. There are also no entries in the audit log (the requests for the builds that have been done are there).
I also do not see any "is ignored as there is an identical request in queue" in the server log. On affected builds there are no preQueue script, preBuild script or the like. We tried periodical and cron based schedule with no difference. In general, these are very simple builds outside all our other pipeline logic, without any sophisticated scripting. For example, right now we had this again, for a config that is scheduled at 0 0/5 * * * ? with a cron schedule (was a periodical schedule with 300 seconds before) and the list of executions is:
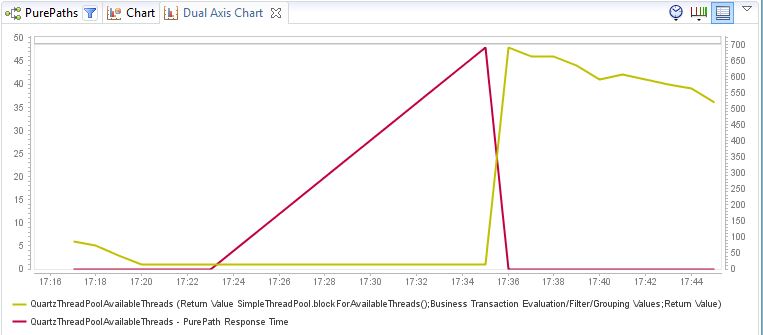
2016-04-08 13:21:10 2016-04-08 13:16:06 2016-04-08 13:00:54 2016-04-08 12:56:07 2016-04-08 12:50:34 as you can see, there are 2 executions missing between 13:00 and 13:16 I just instrumented Quartz SimpleThreadPool.blockForAvailableThreads() and captured return value and execution time (method response time).
The conclusion is that the Quartz scheduler ThreadPool (SimpleThreadPool) is exhausted. The attached chart shows that before 17.23 the number of available thread continuously goes down to one (yellow line, left axis), then it blocks, red line = method response time goes up. It blocks for 12 minutes(!!!) at 17:23:58.464 it starts blocking and at 17:35:29.507 it returns with 1 thread. 3 Calls and 7 seconds later the method returns with 49(!) free threads. the audit log matches this exactly, as in that time no new builds were requested by the scheduler: Apr 08, 17:35:35, Friday Anonymous This configuration Build request was submitted by schedule // 17:25 and 17:30 were skipped due to thread pool exhaustion. Apr 08, 17:20:36, Friday Anonymous This configuration Build request was submitted by scheduler. After that it continously goes down again with a rate of about 1 per minute, on average. As a result I will check all configs if we have a lot with very short intervals and will increase them. But it would also be fine to make the thread pool a bit larger or make it configurable in a future QB version. PS: Of course this analysis was done with DynaTrace!!!
Thanks for the great analysis. We hard coded the thread pool to be 50 threads and it is enough according to our support experience on many sites, and adding more threads to avoid the schedule missing might not be a good idea if the system is already heavy loaded. Can you please check how busy the CPU and I/O is when this happens?
We just ran into the same situation again, and I was bright enough to pull a threaddump during threadpool exhaustion.
All the 50 threads hang in the same location com.pmease.quickbuild.DefaultBuildEngine.terminateIdleBuildAgents() : DefaultBuildEngine.java:2419 com.pmease.quickbuild.Quickbuild$4.execute() : Quickbuild.java:785 DefaultBuildEngine.java:2419 is a synchronized(this) block. this also explains why, after blockForAvailablThreads() returns, we suddenly have 48 threads available again. because they all are doing the same it this is quite quick they will all finish fast after they get the monitor on this, and then suddenly all the threads are free. The only synchronized(this) blocks I see in DefaultbuildEngine are in terminateIdlebuildAgents (the one which is hanging), in shutdown and in the main request loop in run(). Since I can only instrument method entry and exit, it is a bit hard to instrument the run loop there is nothing to get hold of. I try to turn on trace log level for DefaultBuildEngine and see if it helps. The trace log shows that the longest part of our request loop is everything that happens before "Nodes and resources are prepared..." which is understandable since we always have about 300-500 requests in the queue and 125 nodes. That makes a total of 62500 iterations, which take up between 8 - 15 seconds.
I also see, that there is usually no pause by the processingSemaphore, the loops follow each other close-packed. I guess that since the synchronized in the run-loop is within one thread and all other requests for the lock come from other locks and add to this unfair locking, the other synchronization requests don't get a chance. Maybe a Thread.yield() or a sleep(10) before the semaphore acquisition could help? or processImmediately is called too often? We on the other hand will try to reduce pending thread requests. [^
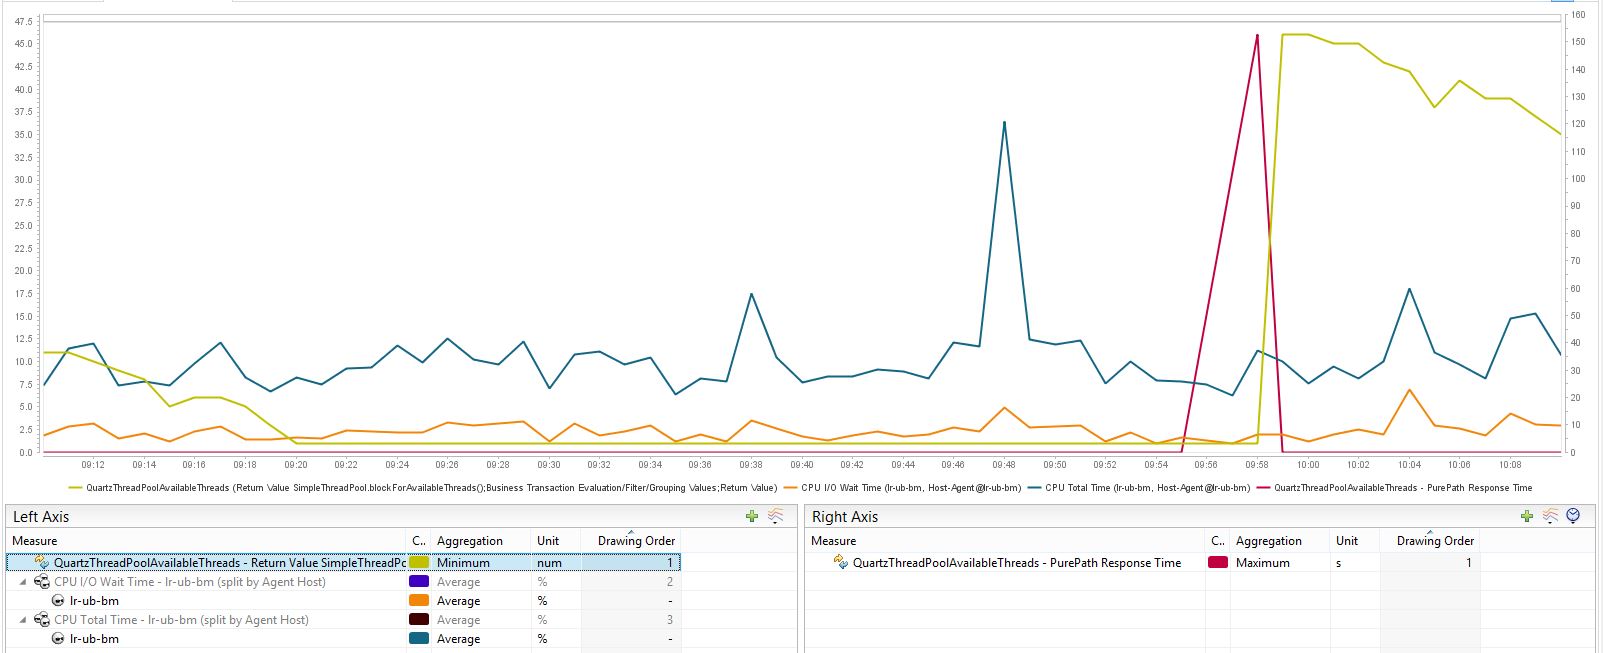
blue: total CPU load % (left axis) orange: IO wait time % (left axis) yellow: available Quartz threads # (left axis) red: blockForAvailableThreads response time seconds (right axis) The "synchronized (this)" is actually not necessary (previously added to guard thread variable of DefaultBuildEngine, but that variable was changed to volatile). Will remove that in next patch release. Thanks for the awesome findings!
| |||||||||||||||||||||||||||||||||||||||||||||||||||||||||||||||

