|
History
| Log In
|
|
|
|
[
Permlink
| « Hide
]
Robin Shen [05/May/15 11:20 PM]
While this is happening, please check if heap memory of QB is used up, also please check the build queue page to see how many builds are queued there.
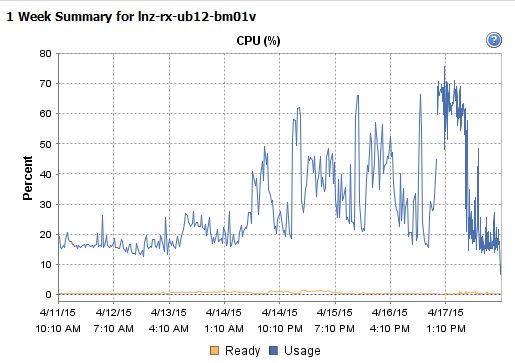
In fact we noticed similar problems with lower QB 6 version. The Cpu is exhausted and heap is also around 90% constantly in case the problem occurs. There is no other way out except restanten serve, even forcing garbage collects on the JVM process have no effect.
How many build requests exist in queue in this case?
Our queue was containing ~500 items at the point in time it happened. Cleaning whole queue didn't resolve the problem, only full restart helped. There were constant full garbage collects visible in the logging of the JVM.
Do you have any RESTful programs frequently pulling configuration data from QuickBuild? If yes, disable them temporarily or reduce frequency to see if it helps. Another reason can be that some custom script loading configuration to do some heavy jobs frequently to result in a lot of memory fragments to cause GC busy.
This is especially true when there are many configurations in the system.
We are doing all of the mentioned points:
* we are frequently accessing configuration data by rest calls * we use custom groovy scripts accessing approx 600-700 configurations frequently * we do have many configurations (approx 2200 configurations) But the strange thing is, that it works fine for approx 10 days without any performance/memory issues, before quickbuild server process starts consuming resources (memory and cpu) exponentially. Please take a memory dump with jmap to see what is consuming most of the memory when this happens.
| |||||||||||||||||||||||||||||||||||||||||||||||||||||||||||||||||||
