|
History
| Log In
|
|
|
|
[
Permlink
| « Hide
]
Roger Perkins [05/Feb/10 04:58 PM]
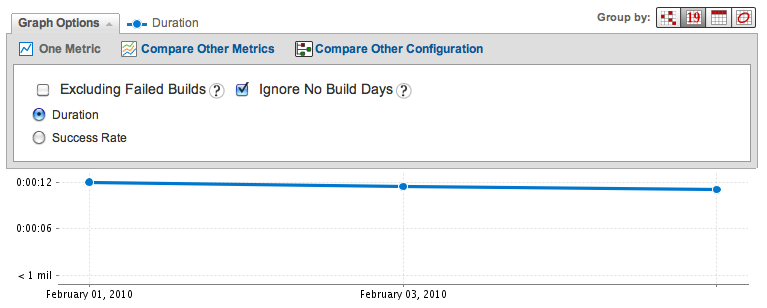
I'll add a request for the system option. With respect to the line, can you not draw it across the gap, so that you have a line spanning twice the width it would normally be (where a zero day occurs) and the line is never broken? That way you'll be able to see missing points on the line graph where days have registered no builds and still not have it alter the spacing of the days.
Text is now rendering better in 2.1.5. The option is indeed remembered for the current browsing session across all configs, however it might be nice to have it remembered across sessions. Is it possible to display the graph with the original spacing of a column per day but just not plot a point for a day with zero builds, which would solve the scenario you suggest plus not show zero success due to no builds.
1. For IE 8, it is odd. I can't reproduce, I also test on the same platform, still no lucky. I changed my css a little, hope this will be helpful.
2. We will build 2.1.5 today, you may download about one or two hours later, please upgrade to that version to see whether it can meet your requirements. I have fixed the bug and also the options you set will be remembered. 1. I'm on Win7 x64 with IE8 v8.0.7600.16385, I'll add a shot in a sec
3. I see your point with the way the option is working, I don't know how the graph plotting works, but if you maintained the previous spacing as when you had the zero days plotted but didn't plot a point on those days such that the line spanned across them (with the same gap) then you could tell no builds occured but not show a failure? 1. For IE8, in our environment, I haven't found any display problems. Please attach your screen shot. By the way, my IE version is: 8.0.6001.18702.
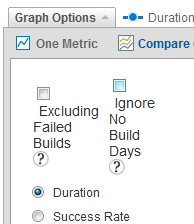
2. For remembering the options, this will be added in next version. 3. For why not set the ignoring no build days, let's see below case: ----------------------------------------------------- Day With Builds 1 yes 2 yes 3 no 4 yes 5 no 6 no 7 no 8 yes 9 yes 10 no ----------------------------------------------------- If we draw a line without those days which have no builds, then you will hard to tell which days you have builds and which days you haven't. Also, it's hard to know how long you haven't build the software. Maybe we can add this option as a system setting later, but I can't make sure when this will be available now. 4. For the radio group in Graph options and Tab buttons on the left, you are right, they are same. The reason for adding radio group here is for your convenience. And another reason is that, when you change any options (for example, changing the group option, changing the date range, etc.) for one metric, you can easily compare another metric by clicking the radio box in Graph Options. 5. For the radio button is not actually set, this is a bug! And also this will be fixed in next version. When viewing those options in IE8 it displays all the text for the new options in a vertical column for each selection. In addition, they both default to off (without them being remembered), which seems the wrong way around as I can't imagine why anyone would want to include days without builds in their success rate graph anyway as it makes the results badly inaccurate.
In addition, the graph options shows two radio buttons for Duration and Success rate that seem to mirror the buttons on the left, yet despite clicking on them and them changing the graph it doesn't change the shown option on the left plus it doesn't properly remember which radio button is actually set. I've just upgraded to 2.1.4 and the problem still seems to be there. If I go to the statistics tab I'm still seeing the graph and table below showing 0% for days without any builds occuring which makes the graph look worse than it should. Should this fix be in 2.1.4?
| |||||||||||||||||||||||||||||||||||||||||||||||||||||||||||||
