
|
If you were logged in you would be able to see more operations.
|
|
|
QuickBuild
Created: 31/Aug/20 11:56 AM
Updated: 15/Sep/20 12:23 AM
|
|
| Component/s: |
None
|
| Affects Version/s: |
None
|
| Fix Version/s: |
None
|
|
|
Original Estimate:
|
Unknown
|
Remaining Estimate:
|
Unknown
|
Time Spent:
|
Unknown
|
|
File Attachments:
|
None
|
|
Image Attachments:
|
|
|
|
From user:
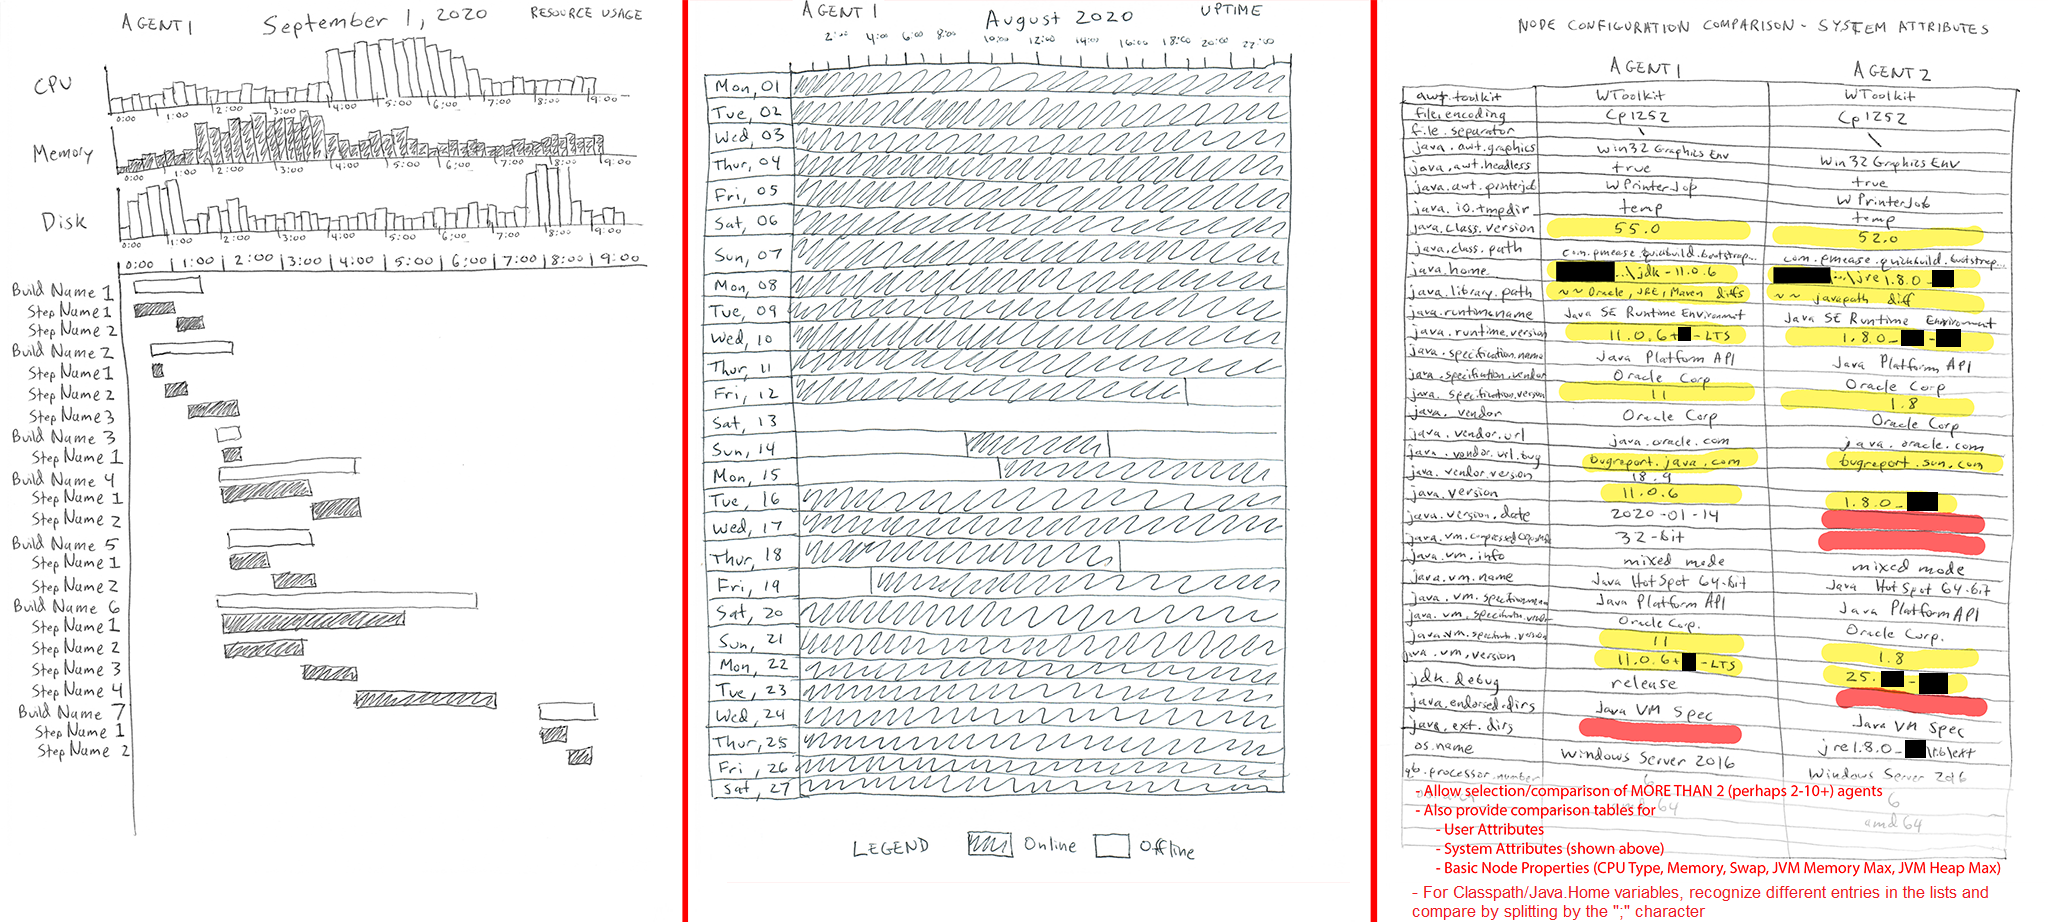
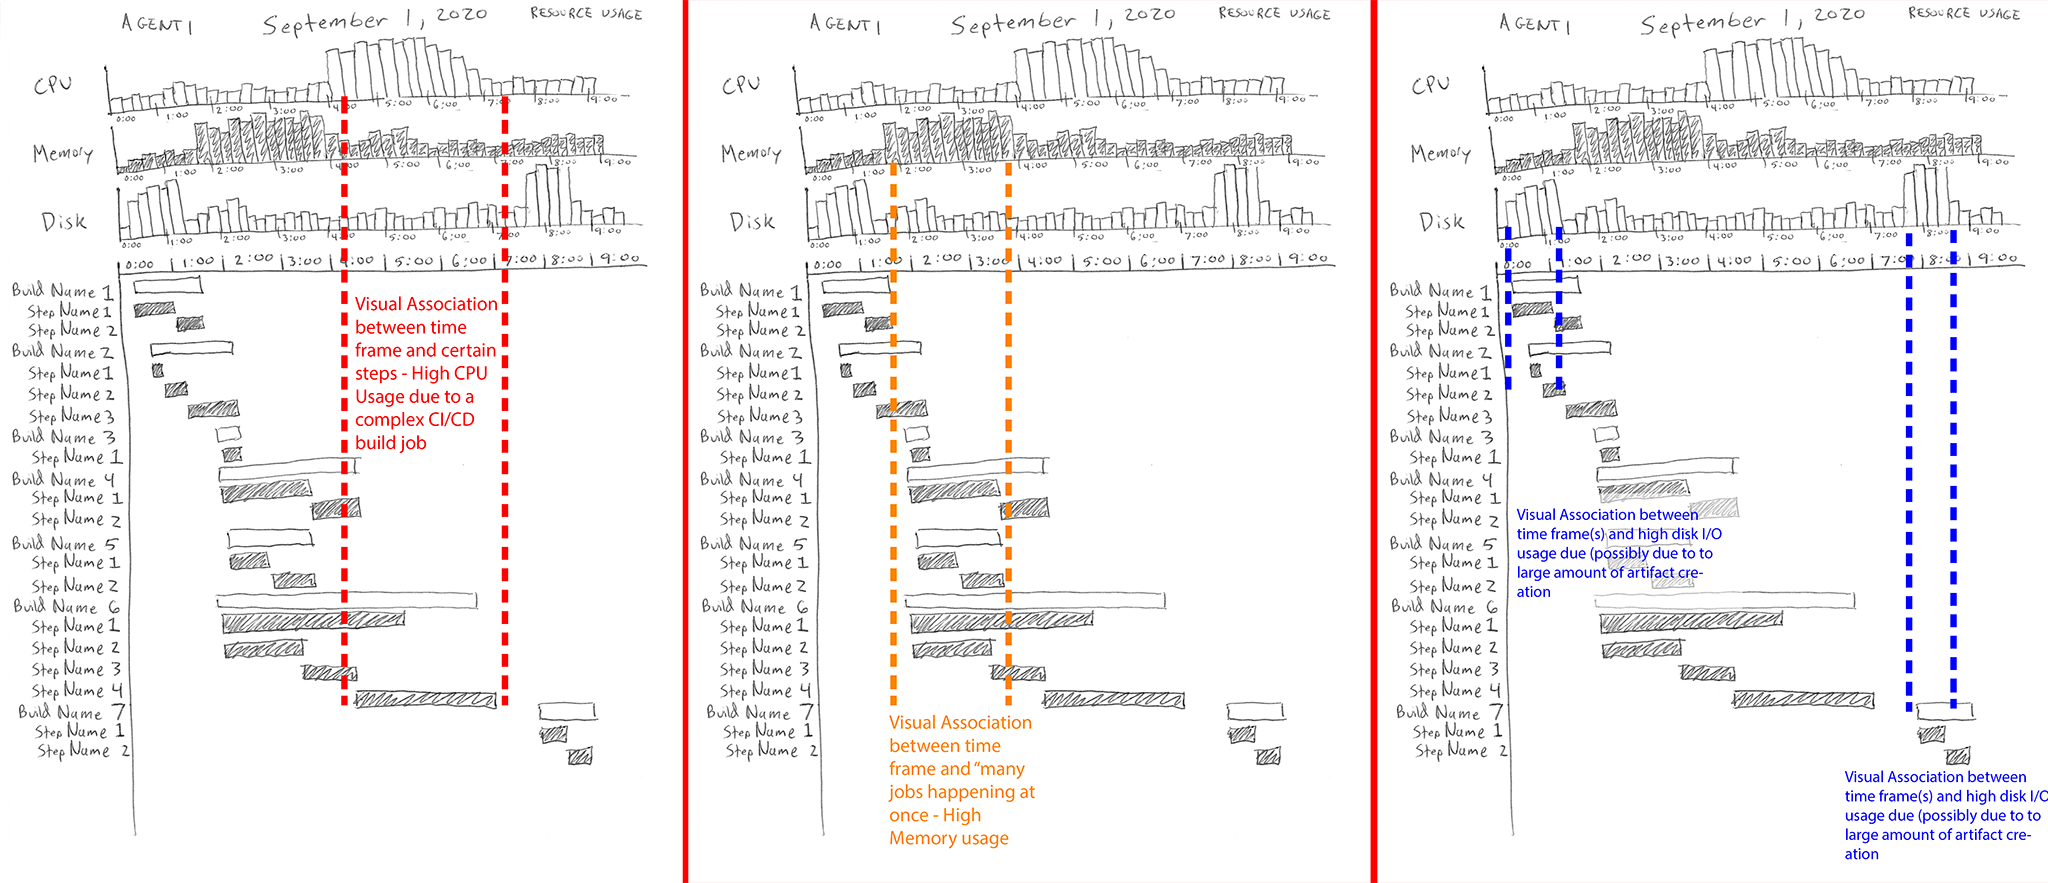
Does QB have any additional features for analyzing resource (CPU, Memory, Disk Performance/Latency) usage on the QB Console and all QB Agents?
I am aware of the "Grid > Active Nodes > Overview" and also "Administration > Plugin Management > System Alert" plugin right now. I am looking for something like that, but with even more data, possibly with consolidated/aggregated data about what builds particular agents' activity over certain time periods.
If I wanted to more fully monitor the Console or Build Agents' health, compare Build Agents, or do analyses on QB memory or disk speed on various agents, would I have to make something custom using the QB REST API, correct?
I looked at the community's Plugins, and there are not many at all. Is there anything that PMease itself could do to give us a more fully-featured health/status monitoring dashboard for the QB grid?
|
|
Description
|
From user:
Does QB have any additional features for analyzing resource (CPU, Memory, Disk Performance/Latency) usage on the QB Console and all QB Agents?
I am aware of the "Grid > Active Nodes > Overview" and also "Administration > Plugin Management > System Alert" plugin right now. I am looking for something like that, but with even more data, possibly with consolidated/aggregated data about what builds particular agents' activity over certain time periods.
If I wanted to more fully monitor the Console or Build Agents' health, compare Build Agents, or do analyses on QB memory or disk speed on various agents, would I have to make something custom using the QB REST API, correct?
I looked at the community's Plugins, and there are not many at all. Is there anything that PMease itself could do to give us a more fully-featured health/status monitoring dashboard for the QB grid? |
Show » |
| No work has yet been logged on this issue.
|
|

