
| Key: |
QB-3098
|
| Type: |
 Improvement
|
| Status: |
 Open
Open
|
| Priority: |
 Major
Major
|
| Assignee: |
Steve Luo
|
| Reporter: |
J. Mash
|
| Votes: |
0
|
| Watchers: |
0
|
|
If you were logged in you would be able to see more operations.
|
|
|
QuickBuild
Created: 15/Dec/17 04:55 PM
Updated: 15/Jan/18 06:11 PM
|
|
| Component/s: |
None
|
| Affects Version/s: |
None
|
| Fix Version/s: |
None
|
|
|
Original Estimate:
|
Unknown
|
Remaining Estimate:
|
Unknown
|
Time Spent:
|
Unknown
|
|
File Attachments:
|
None
|
|
Image Attachments:
|
|
|
|
This is an improvement request to update the custom statistics widget such that the embedded image will span the entire width of the widget itself. In some circumstances, there's a substantial amount of whitespace to the right of the embedded image that could probably be better used for displaying the graph.
The other widgets I've looked at seem to do this automatically (build stats, grid measurement), so this might be more of a bug report than an improvement request.
|
|
Description
|
This is an improvement request to update the custom statistics widget such that the embedded image will span the entire width of the widget itself. In some circumstances, there's a substantial amount of whitespace to the right of the embedded image that could probably be better used for displaying the graph.
The other widgets I've looked at seem to do this automatically (build stats, grid measurement), so this might be more of a bug report than an improvement request. |
Show » |
|
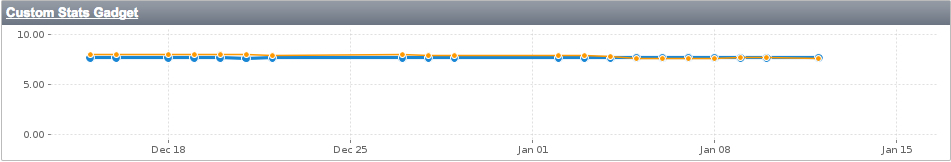
1. CustomStatsWidget-AfterAdd.jpg - This is what the widget looks like immediately after adding it to the dashboard, and everything spans correctly.
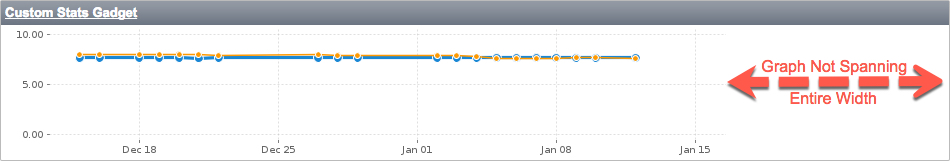
2. CustomStatsWidget-AfterRefresh.jpg - This is what the widget looks like after the dashboard to which the widget was added has been refreshed (a simple browser refresh should show the same issue).
I have noticed that this happens to all of the graph-based widgets on the dashboard, and not just the custom stats widget (as I had indicated in the description above), however the behavior does not exhibit itself until after the dashboard has been refreshed in some way. I suspect that this behavior is linked to the various "Aggregated Table" dashboard widgets (such as the ones available for Bullseye and JUnit).
To replicate our dashboard:
1. Create a new dashboard with the 'Two Columns (Right Wide)' layout
2. Add a 'Configuration and Build > Build Stats' widget to the left column.
3. Add a 'Code Coverage Reports > Bullseye Aggregated Table' widget to the left column.
4. Add a 'Unit Test Reports > JUnit Aggregation Table' widget to the left column.
5. Add a 'Configuration and Build > Build Pipeline' widget to the right column.
With this configuration, I have noticed the following:
1. When the 'Build Stats' widget is placed above the two aggregated table widgets, such that it loads BEFORE those two, the spanning issue occurs.
2. When the 'Build Stats' widget is placed below the two aggregated table widgets, such that it loads AFTER those two, the spanning is always correct.
3. When the two aggregated table widgets are moved to the right column, the width of the left column is reduced (indicating that the aggregated table widgets have a larger minimum width value), and the 'Build Stats' widget displays correctly.
4. When the layout is changed to 'Two Columns', the 'Build Stat's widget displays correctly.
5. All other widgets we currently use span correctly regardless of the existence of the 'Aggregated Table' widgets or their ordering, it's just the graph-based widgets that have this issue.
Hopefully that helps narrow down the issue a bit, but feel free to reach out if I can provide any further information.
-J. Mash